Scientific Visualization & Explorers
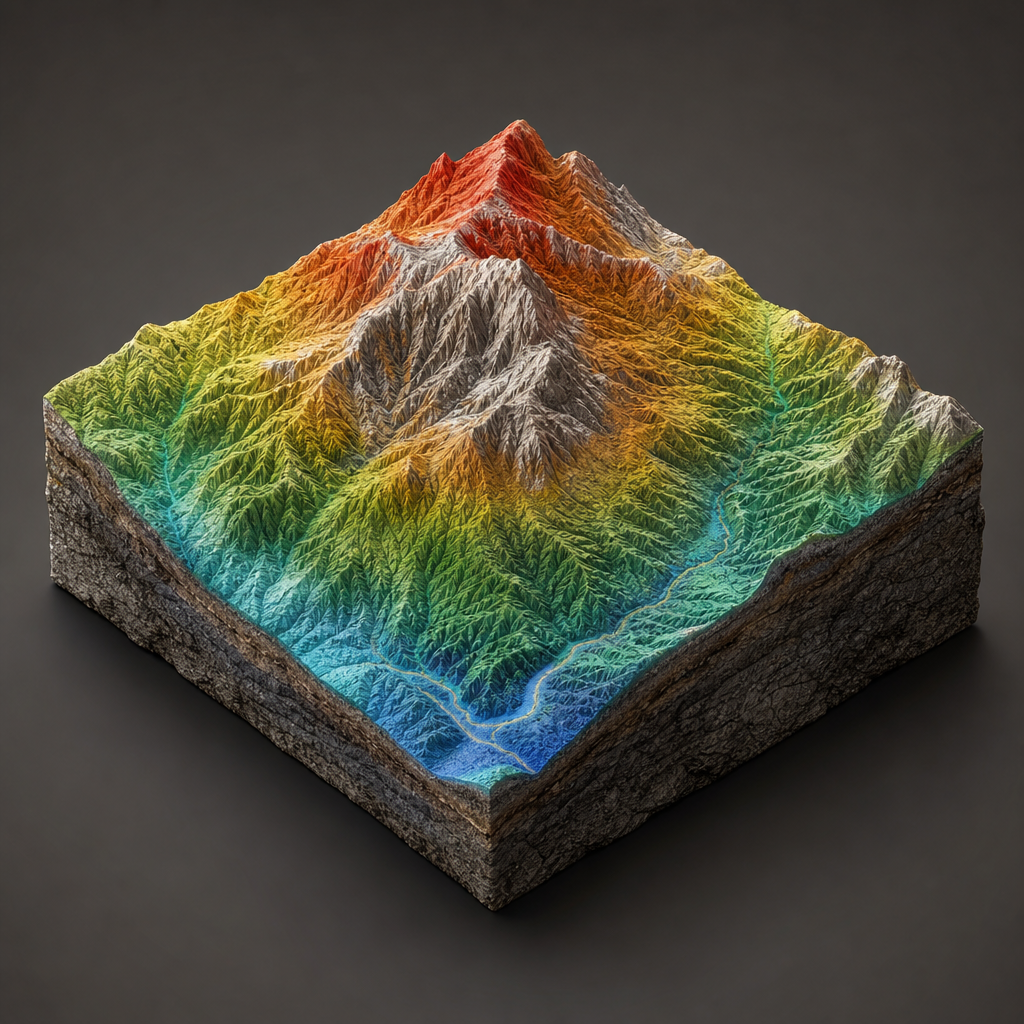
Scientific Visualization & Explorers brings together tools for seeing data at scales that are hard to grasp any other way — from satellite imagery and lidar terrain models to protein structures, particle physics events, and global development trends. If you’re working with Earth data, resources like EarthExplorer, OpenTopography, and NASA Earthdata help you find, filter, process, and learn from geospatial and environmental datasets. For scientific research closer to the molecular or experimental edge, RCSB PDB and the CERN Open Data Portal offer structured access to curated 3D biomolecular data and real high-energy physics datasets, along with viewers, documentation, APIs, software environments, and educational materials that make the underlying science more approachable.
There’s also a strong thread here for people who want to communicate data clearly, not just access it. Datawrapper, Observable Notebooks, and Plotly’s Chart Studio transition page point toward practical ways to build charts, maps, tables, interactive notebooks, and data apps, with options for publishing, collaboration, embedding, and updates. Meanwhile, Gapminder and Our World in Data show how thoughtful visualization can challenge assumptions and make complex global topics easier to explore, whether through animated tools, quizzes, reusable charts, research articles, or even photo-based comparisons of everyday life around the world. Taken together, this subcategory is a useful starting point for researchers, educators, journalists, students, and curious browsers who want data they can not only download, but investigate, visualize, and share.